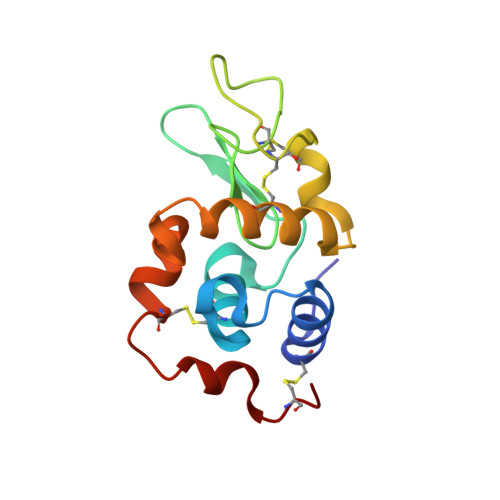
4TWS

Gadolinium Derivative of Tetragonal Hen Egg-White Lysozyme at 1.45 A Resolution


Experimental Data Snapshot

  • Method: X-RAY DIFFRACTION
  • Resolution: 1.45 Å
  • R-Value Free: 0.161 
  • R-Value Work: 0.138 
  • R-Value Observed: 0.139 

Starting Model: experimental
View more details

wwPDB Validation   3D Report Full Report


Ligand Structure Quality Assessment 


This is version 1.7 of the entry. See complete history


Literature

The R-factor gap in macromolecular crystallography: an untapped potential for insights on accurate structures.

Holton, J.M.Classen, S.Frankel, K.A.Tainer, J.A.

(2014) FEBS J 281: 4046-4060

  • DOI: https://doi.org/10.1111/febs.12922
  • Primary Citation of Related Structures:  
    4TWS

  • PubMed Abstract: 

    In macromolecular crystallography, the agreement between observed and predicted structure factors (Rcryst and Rfree ) is seldom better than 20%. This is much larger than the estimate of experimental error (Rmerge ). The difference between Rcryst and Rmerge is the R-factor gap. There is no such gap in small-molecule crystallography, for which calculated structure factors are generally considered more accurate than the experimental measurements. Perhaps the true noise level of macromolecular data is higher than expected? Or is the gap caused by inaccurate phases that trap refined models in local minima? By generating simulated diffraction patterns using the program MLFSOM, and including every conceivable source of experimental error, we show that neither is the case. Processing our simulated data yielded values that were indistinguishable from those of real data for all crystallographic statistics except the final Rcryst and Rfree . These values decreased to 3.8% and 5.5% for simulated data, suggesting that the reason for high R-factors in macromolecular crystallography is neither experimental error nor phase bias, but rather an underlying inadequacy in the models used to explain our observations. The present inability to accurately represent the entire macromolecule with both its flexibility and its protein-solvent interface may be improved by synergies between small-angle X-ray scattering, computational chemistry and crystallography. The exciting implication of our finding is that macromolecular data contain substantial hidden and untapped potential to resolve ambiguities in the true nature of the nanoscale, a task that the second century of crystallography promises to fulfill. Coordinates and structure factors for the real data have been submitted to the Protein Data Bank under accession 4tws.


  • Organizational Affiliation

    Department of Biochemistry and Biophysics, University of California, San Francisco, CA, USA; Physical Biosciences Division, Lawrence Berkeley National Laboratory, CA, USA.


Macromolecules
Find similar proteins by:  (by identity cutoff)  |  3D Structure
Entity ID: 1
MoleculeChains Sequence LengthOrganismDetailsImage
Lysozyme C129Gallus gallusMutation(s): 0 
EC: 3.2.1.17
UniProt
Find proteins for P00698 (Gallus gallus)
Explore P00698 
Go to UniProtKB:  P00698
Entity Groups  
Sequence Clusters30% Identity50% Identity70% Identity90% Identity95% Identity100% Identity
UniProt GroupP00698
Sequence Annotations
Expand
  • Reference Sequence
Small Molecules
Ligands 4 Unique
IDChains Name / Formula / InChI Key2D Diagram3D Interactions
DO3
Query on DO3

Download Ideal Coordinates CCD File 
C [auth A],
E [auth A],
G [auth A]
10-((2R)-2-HYDROXYPROPYL)-1,4,7,10-TETRAAZACYCLODODECANE 1,4,7-TRIACETIC ACID
C17 H32 N4 O7
IQUHNCOJRJBMSU-CQSZACIVSA-N
GD
Query on GD

Download Ideal Coordinates CCD File 
B [auth A],
D [auth A],
F [auth A]
GADOLINIUM ATOM
Gd
UIWYJDYFSGRHKR-UHFFFAOYSA-N
CL
Query on CL

Download Ideal Coordinates CCD File 
H [auth A]
I [auth A]
J [auth A]
K [auth A]
L [auth A]
H [auth A],
I [auth A],
J [auth A],
K [auth A],
L [auth A],
M [auth A],
N [auth A],
O [auth A],
P [auth A],
Q [auth A],
R [auth A],
S [auth A],
T [auth A]
CHLORIDE ION
Cl
VEXZGXHMUGYJMC-UHFFFAOYSA-M
NA
Query on NA

Download Ideal Coordinates CCD File 
U [auth A],
V [auth A],
W [auth A],
X [auth A],
Y [auth A]
SODIUM ION
Na
FKNQFGJONOIPTF-UHFFFAOYSA-N
Experimental Data & Validation

Experimental Data

  • Method: X-RAY DIFFRACTION
  • Resolution: 1.45 Å
  • R-Value Free: 0.161 
  • R-Value Work: 0.138 
  • R-Value Observed: 0.139 
  • Space Group: P 43 21 2
Unit Cell:
Length ( Å )Angle ( ˚ )
a = 77.22α = 90
b = 77.22β = 90
c = 38.81γ = 90
Software Package:
Software NamePurpose
PHENIXrefinement
Blu-Icedata collection
XDSdata reduction
XSCALEdata scaling
PDB_EXTRACTdata extraction

Structure Validation

View Full Validation Report


Ligand Structure Quality Assessment 


Entry History & Funding Information

Deposition Data


Funding OrganizationLocationGrant Number
National Institutes of Health/National Institute of General Medical Sciences (NIH/NIGMS)United StatesR01-GM105404
National Institutes of Health/National Institute of General Medical Sciences (NIH/NIGMS)United StatesP50-GM073210
National Institutes of Health/National Institute of General Medical Sciences (NIH/NIGMS)United StatesP50-GM082250
National Institutes of Health/National Institute of General Medical Sciences (NIH/NIGMS)United StatesU54-GM094625

Revision History  (Full details and data files)

  • Version 1.0: 2014-08-20
    Type: Initial release
  • Version 1.1: 2014-10-01
    Changes: Database references
  • Version 1.2: 2016-08-03
    Changes: Derived calculations, Structure summary
  • Version 1.3: 2017-09-13
    Changes: Author supporting evidence, Derived calculations
  • Version 1.4: 2017-11-22
    Changes: Refinement description
  • Version 1.5: 2019-12-25
    Changes: Author supporting evidence
  • Version 1.6: 2023-09-27
    Changes: Data collection, Database references, Derived calculations, Refinement description
  • Version 1.7: 2024-11-20
    Changes: Structure summary